These examples display Cone Penetration Test data from the Basisregistratie Ondergrond from Amsterdam Noord The original GEF and BRO/XML files containing the CPT data was transformed using pygef and bedrock-ge. The CPT's were interpreted into soil types following Robertson (2010) classification.
CesiumJS
Section titled “CesiumJS”This interactive 3D viewer combines multiple geospatial datasets in a single web-based map. Because the CPT data is converted to geospatial standards, it can be easily exported to GeoJSON and visualized alongside other spatial data. The CPTs are displayed as vertical profiles extending into the ground, with each depth interval color-coded by interpreted soil type.
The viewer also includes surrounding context: 3D buildings from the 3DBag and subsurface geology from GeoTOP, a voxel-based geological model of the shallow subsurface. Both are rendered as 3DTiles for efficient streaming in the browser.
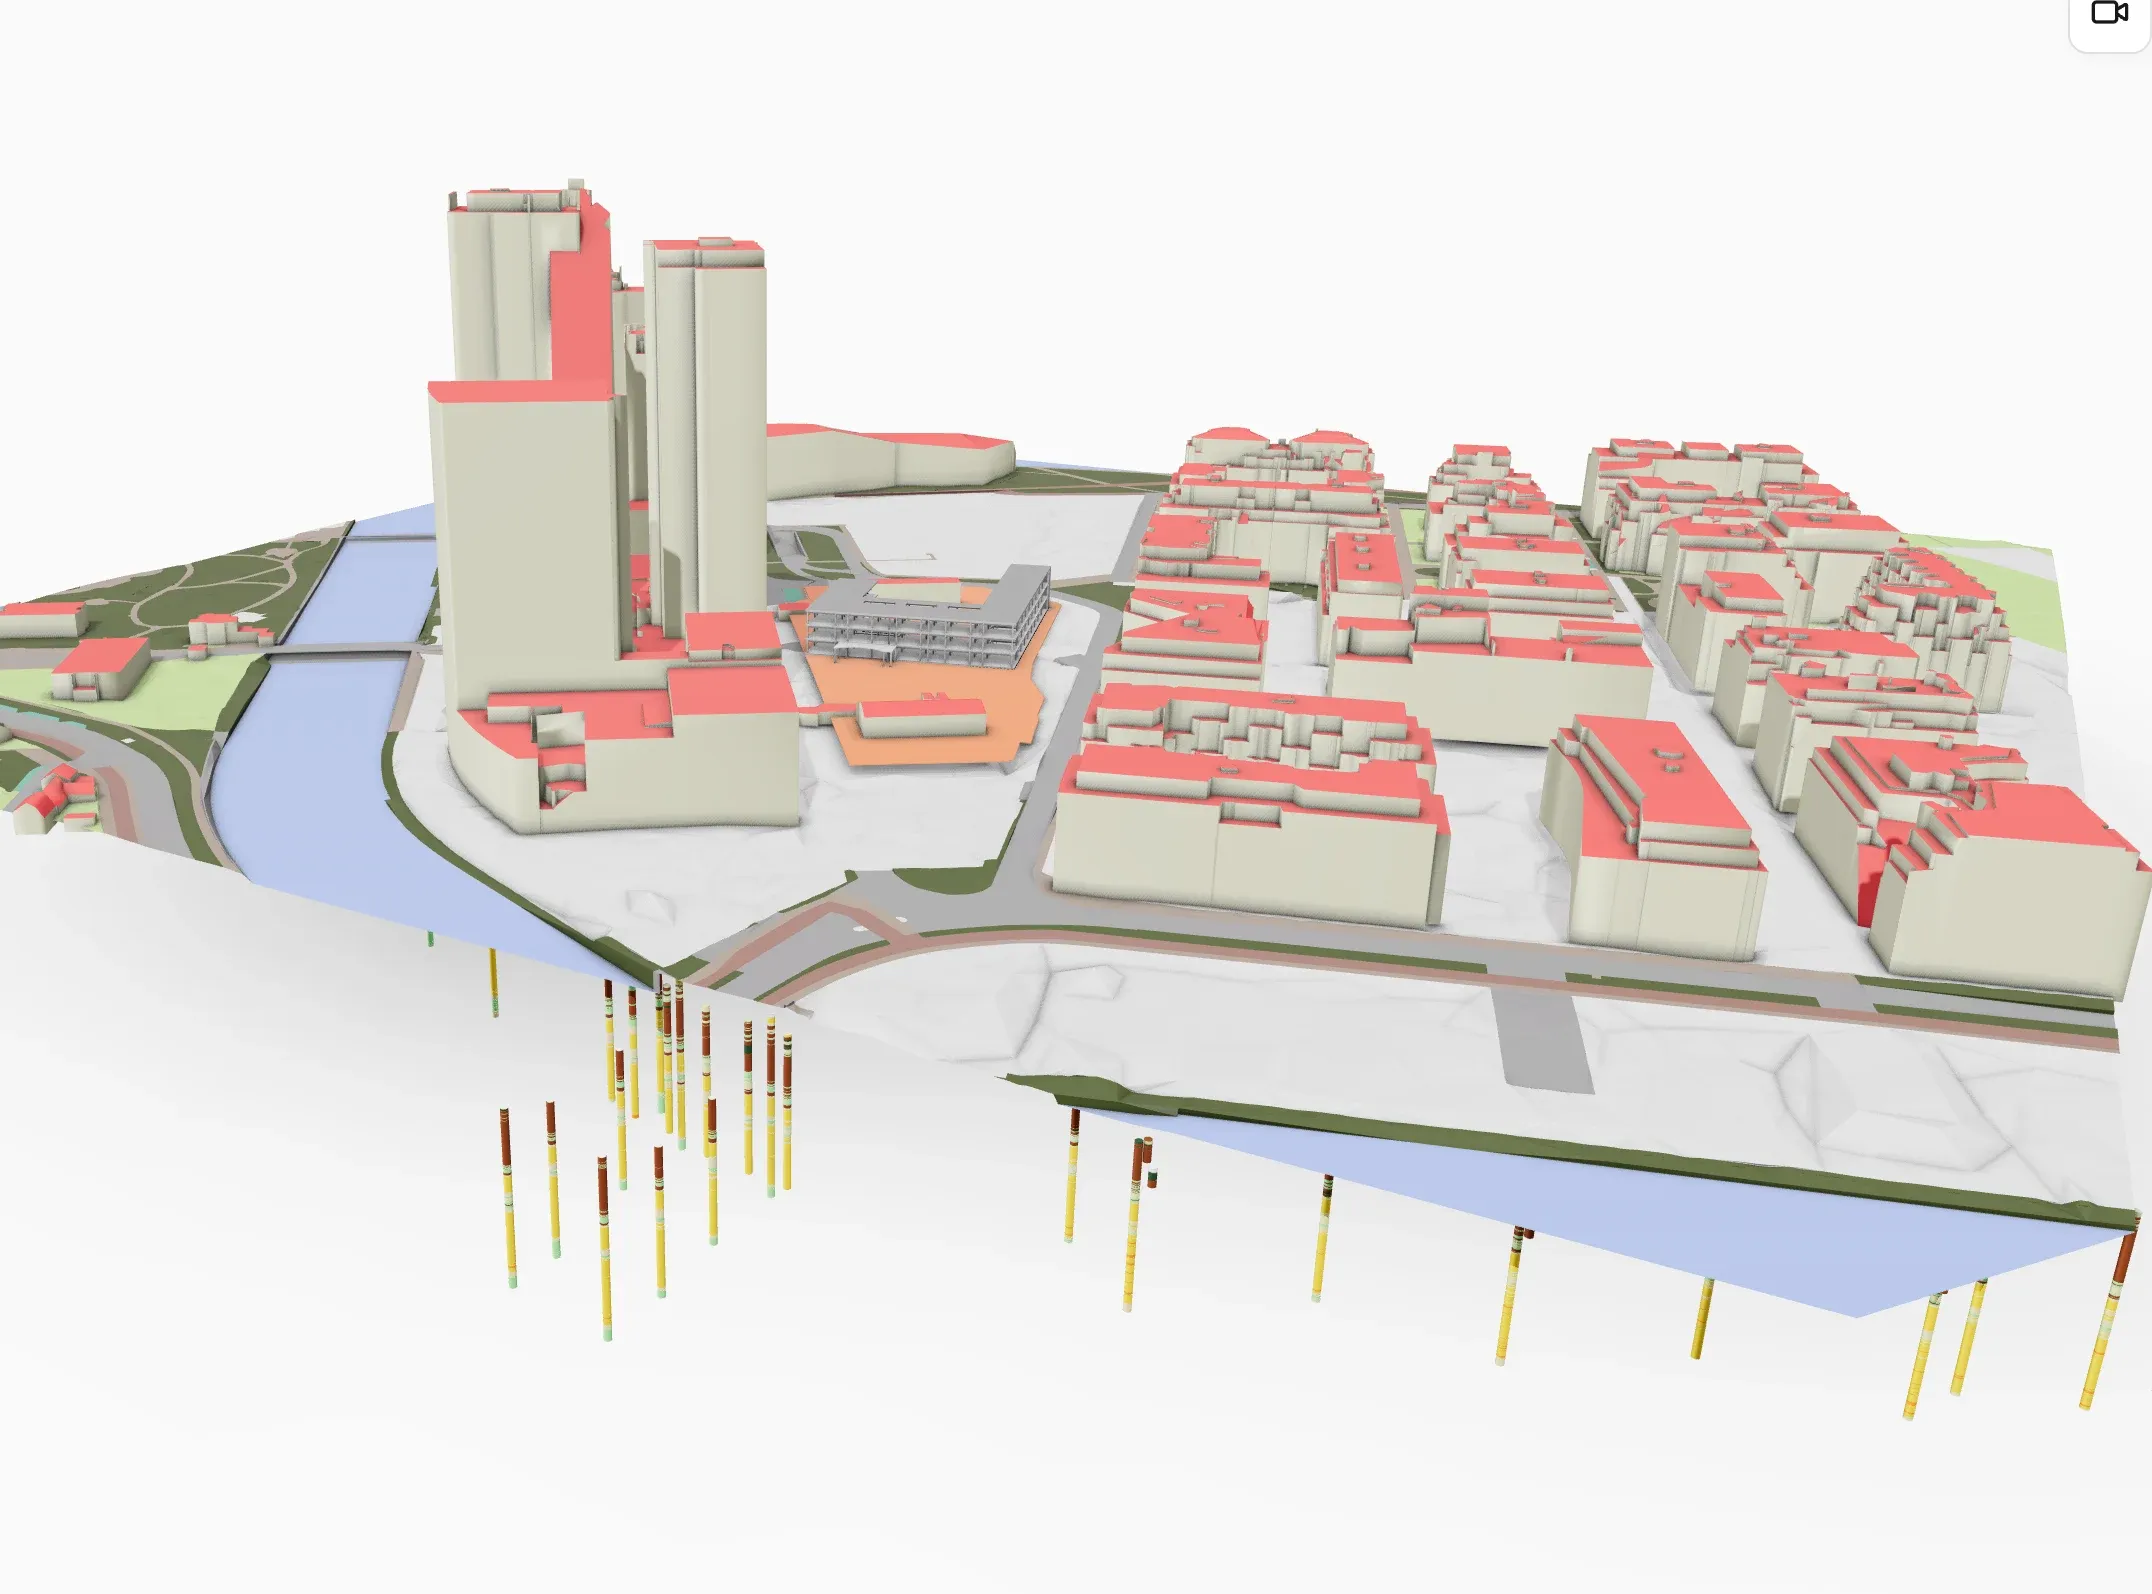
Speckle
Section titled “Speckle”The same CPT data can also be visualized in collaborative AEC platforms. This example shows the ground investigation data integrated with building context, combining data from the 3DBAG, the 3D Basisregistratie Grootschalige Topografie (BGT), and a BIM model in a single Speckle workspace.