Interactive Demos
Subsurface and BIM Data Visualizations
Explore real-world examples of subsurface and BIM data across different platforms and tools. See ground investigation data in CesiumJS 3D maps and Speckle, and bridge Geo and BIM with browser tools like the IFC Georeferencer.
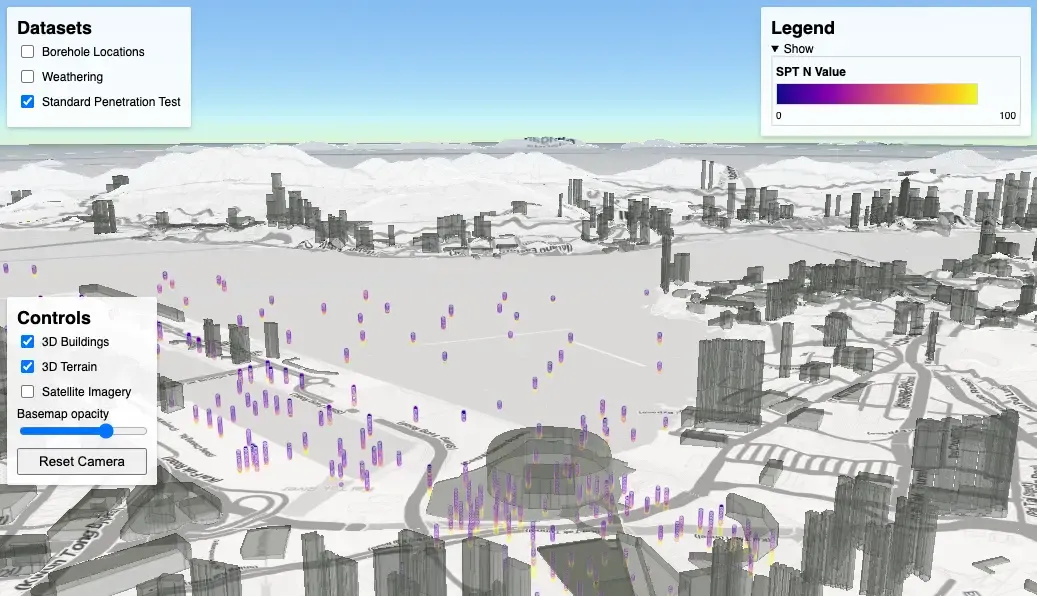
Kai Tak, Hong Kong - CesiumJS
Ground investigation data from Kai Tak, Hong Kong visualized in an interactive CesiumJS map. Explore borehole locations, SPT results, and weathering grades in 3D context directly in your browser. Source data transformed from AGS3 format to GeoJSON using
Explore demo→bedrock-ge for web visualization.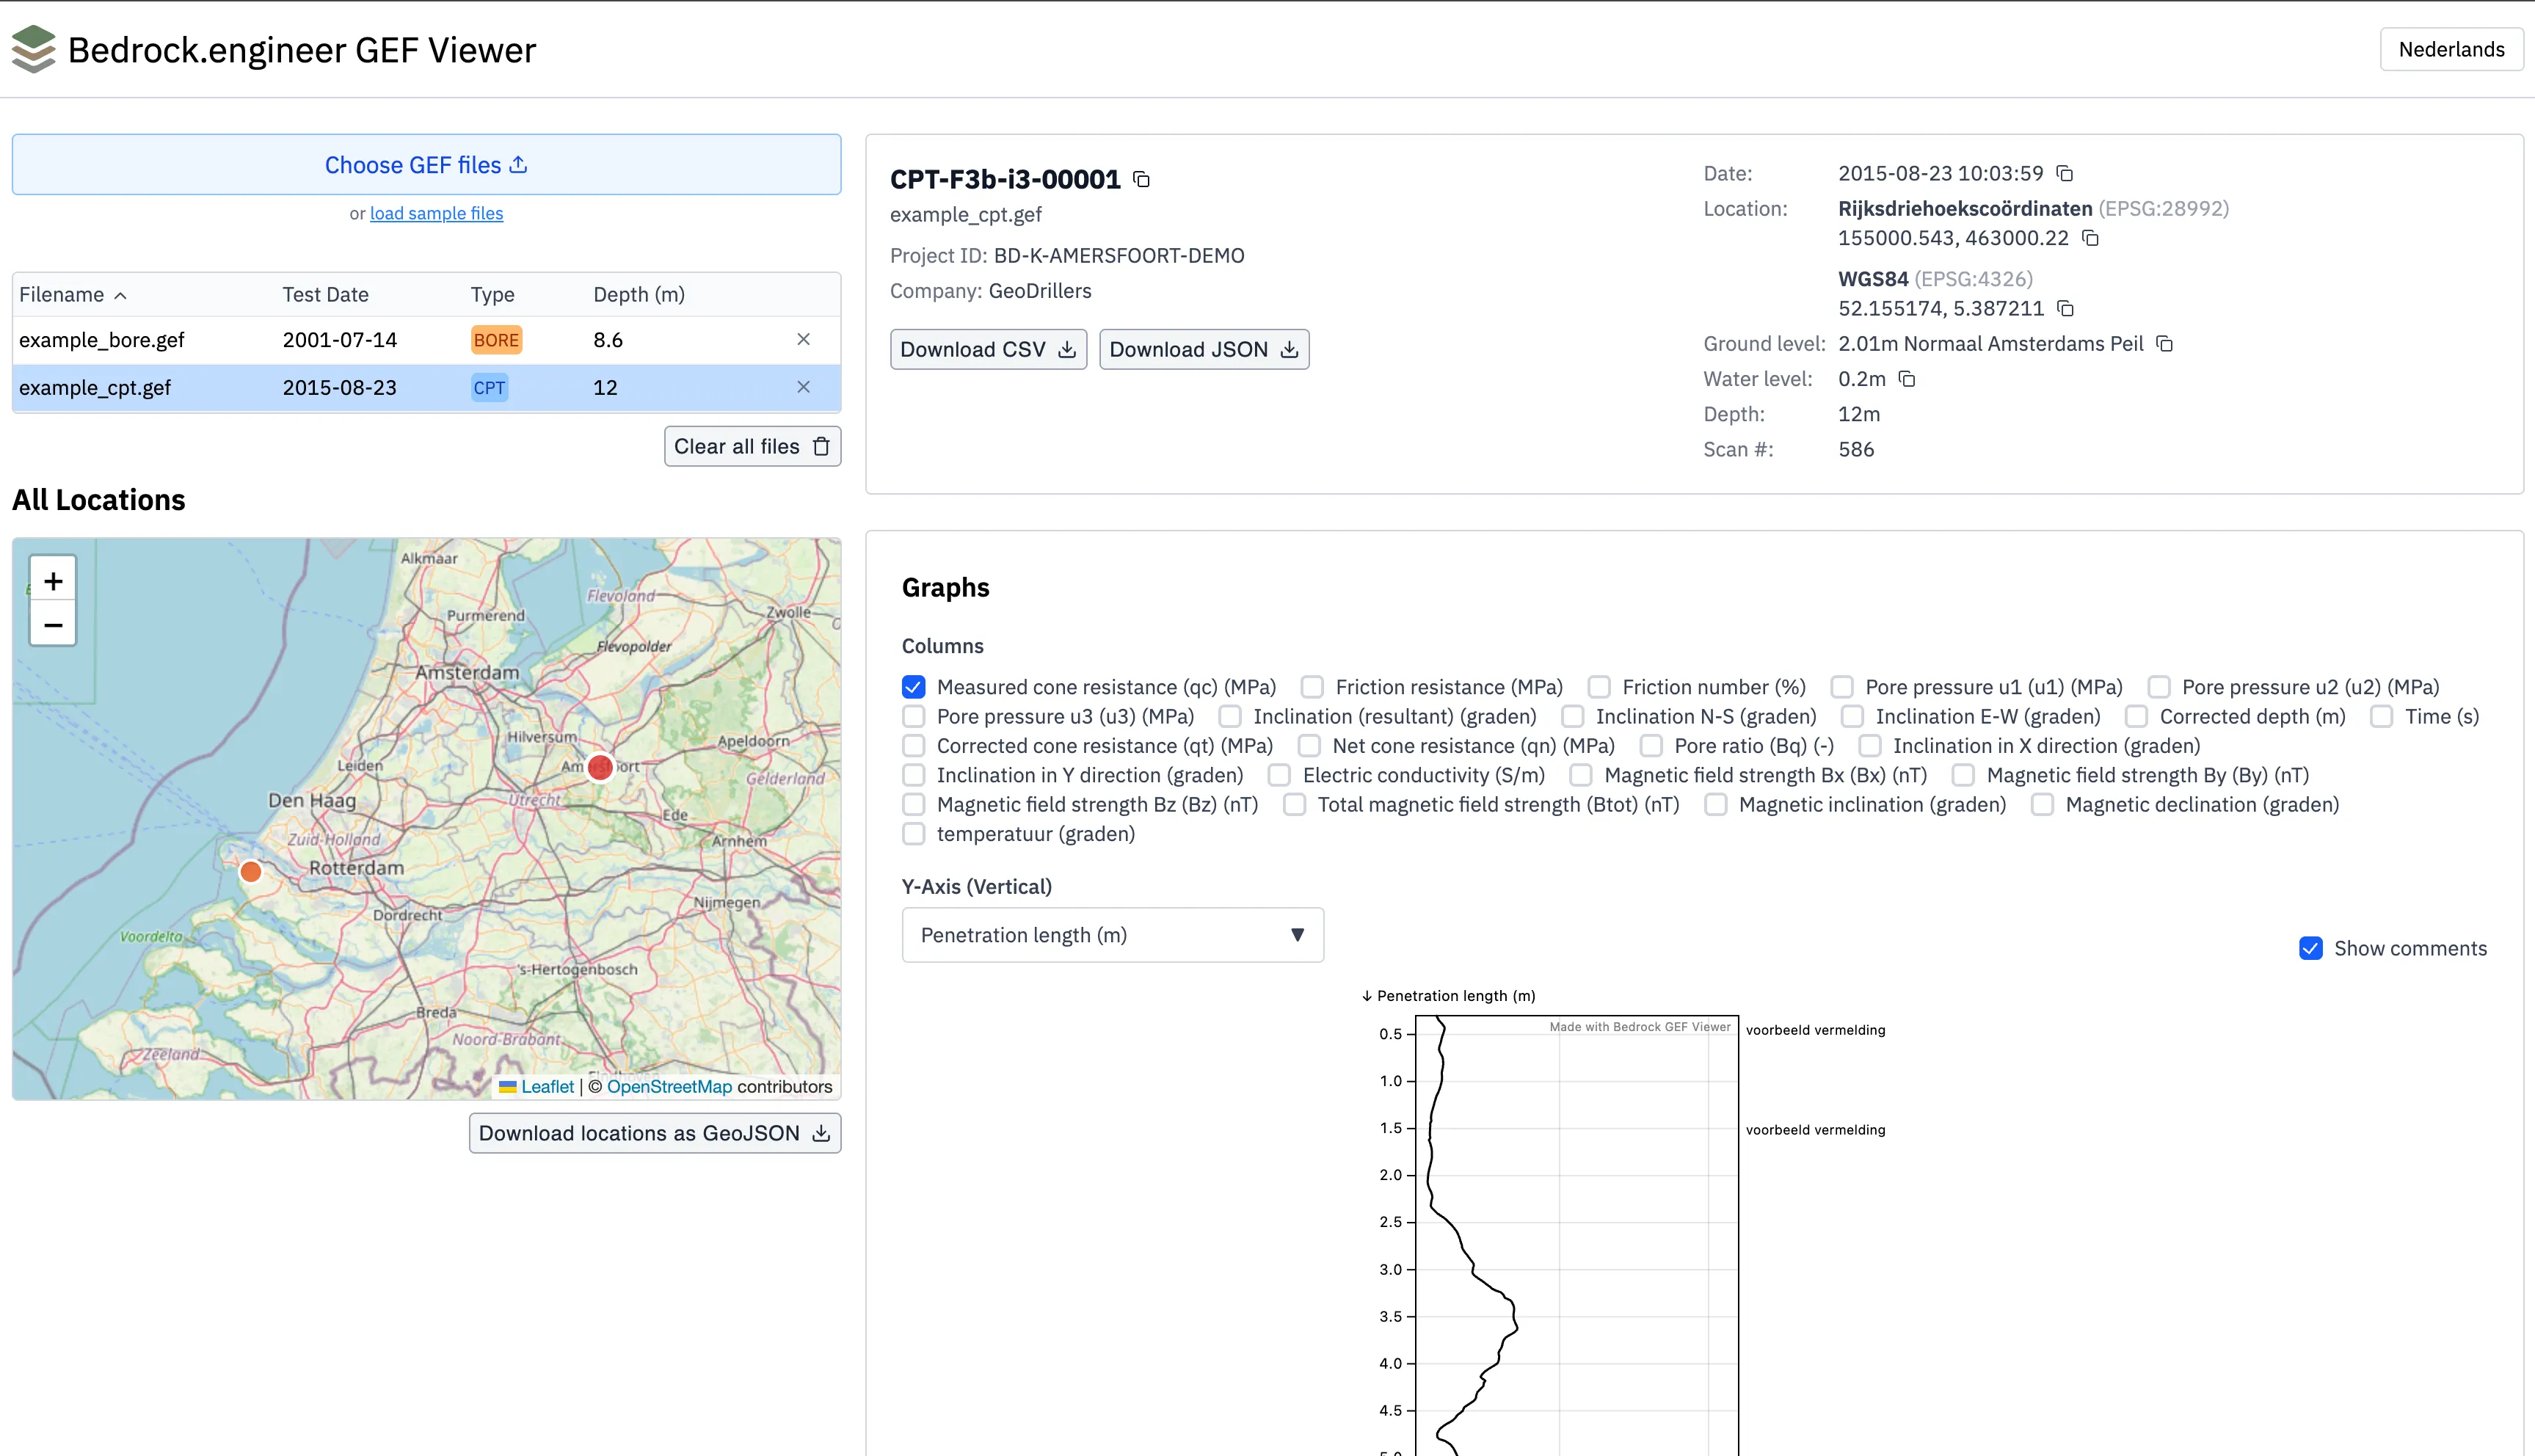
BRO/XML File Viewer
Free web-based viewer for BRO/XML (Basisregistratie Ondergrond) files. Upload and visualize CPT, geotechnical borehole and lab analysis, and geological borehole data directly in your browser.
Open BRO/XML viewer→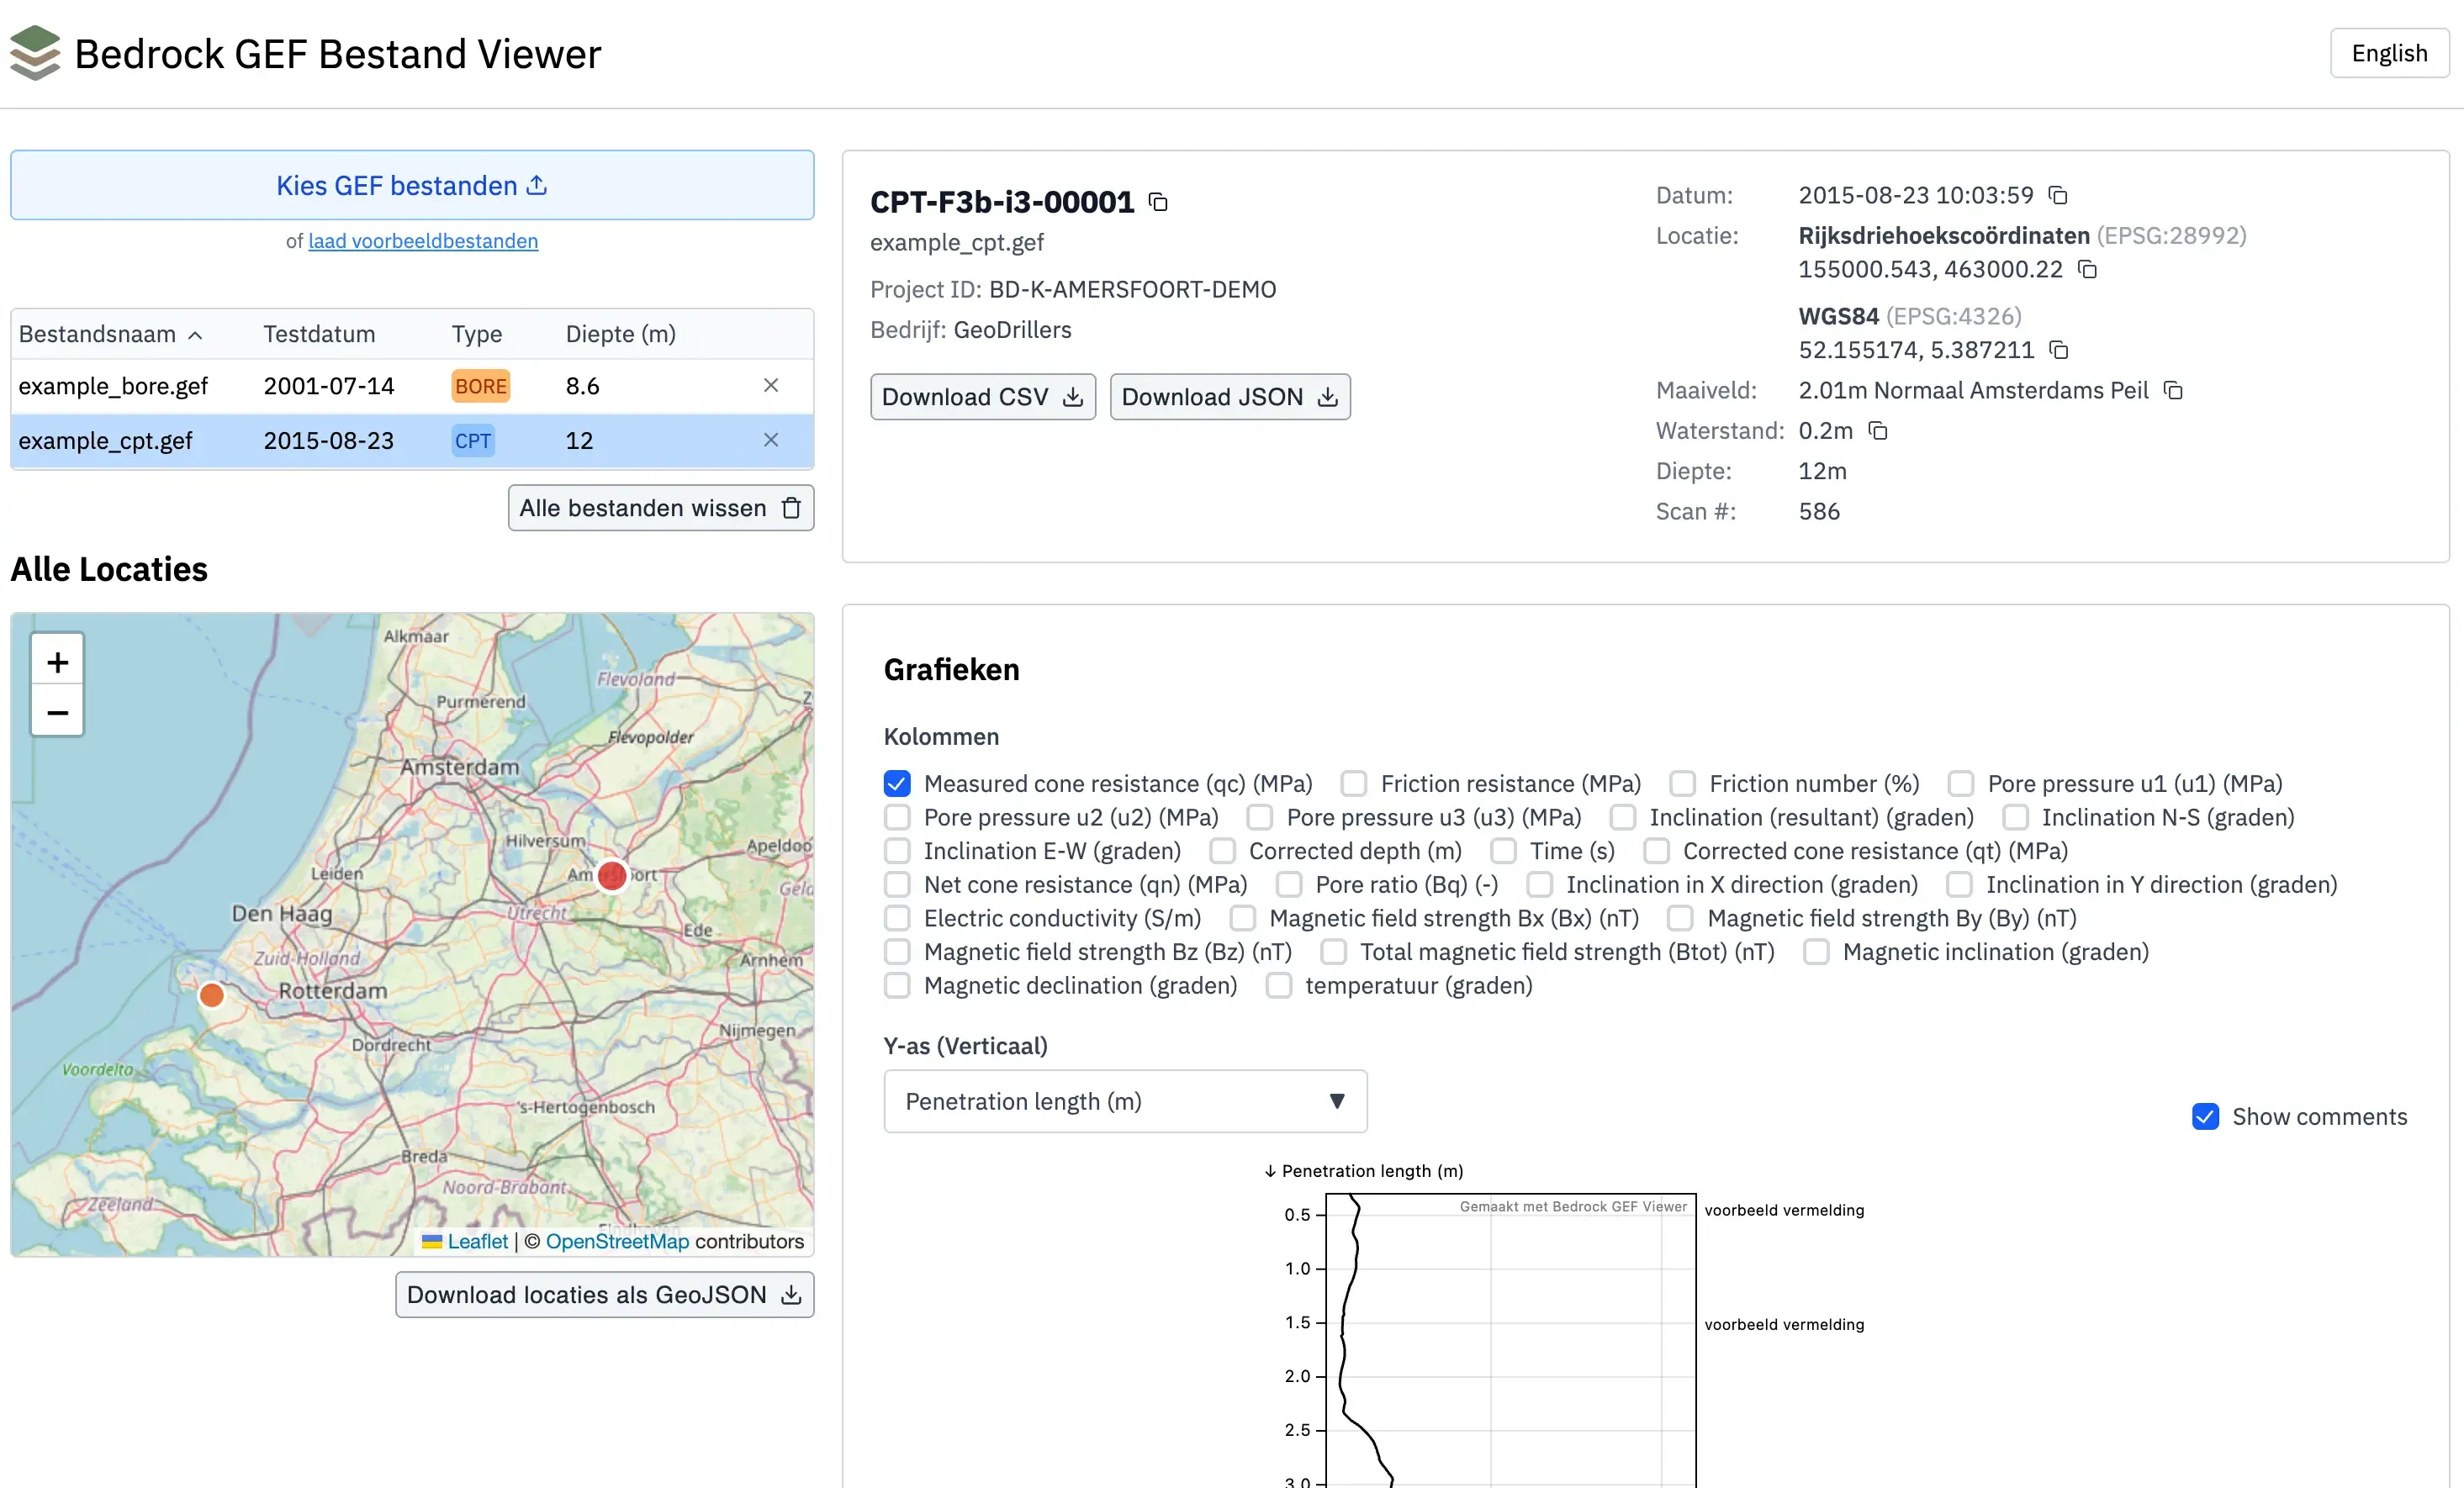
GEF File Viewer
Free web-based viewer for GEF (Geotechnical Exchange Format) files. Upload and visualize CPT & bore data directly in your browser.
Open GEF viewer→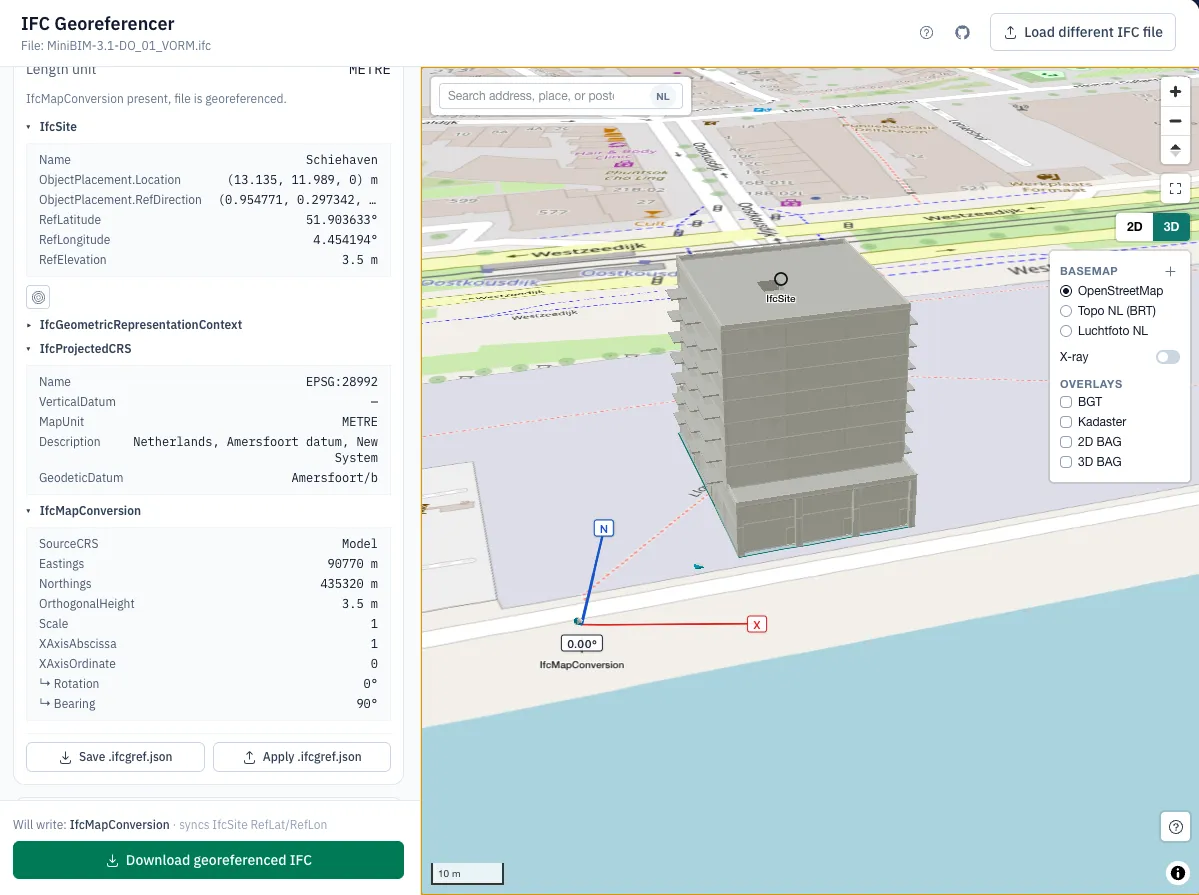
IFC Georeferencer
Georeference an IFC file entirely in your browser. Place the model on a map or enter survey points, solve a Helmert transformation, and download an IFC with correct
Open IFC Georeferencer→IfcMapConversion and IfcProjectedCRS entities. Built for the buildingSMART NL georeferencing guideline. Source on GitHub.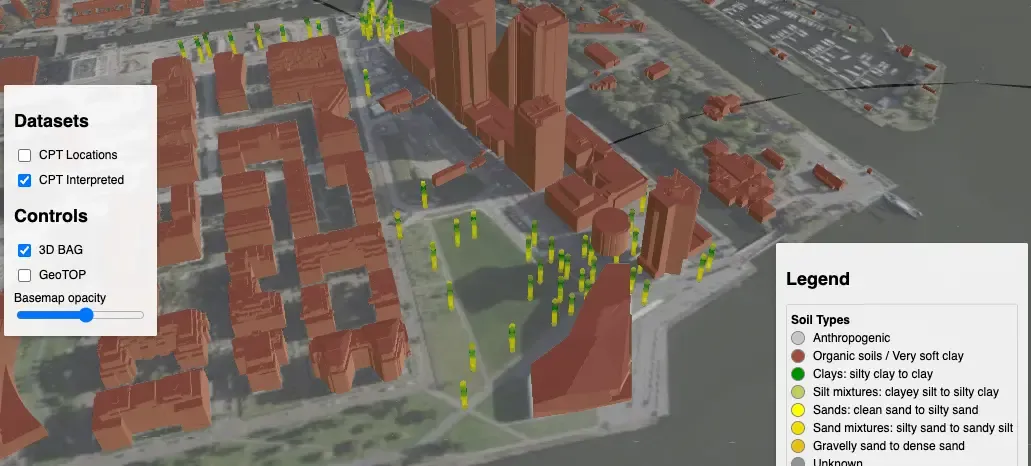
Amsterdam Noord - CesiumJS
Interactive 3D web map showing interpreted Cone Penetration Test data along with Dutch public datasets of 3D Buildings (3DBag), and a 3D geological model (GeoTOP) in Amsterdam Noord using CesiumJS.
Explore demo→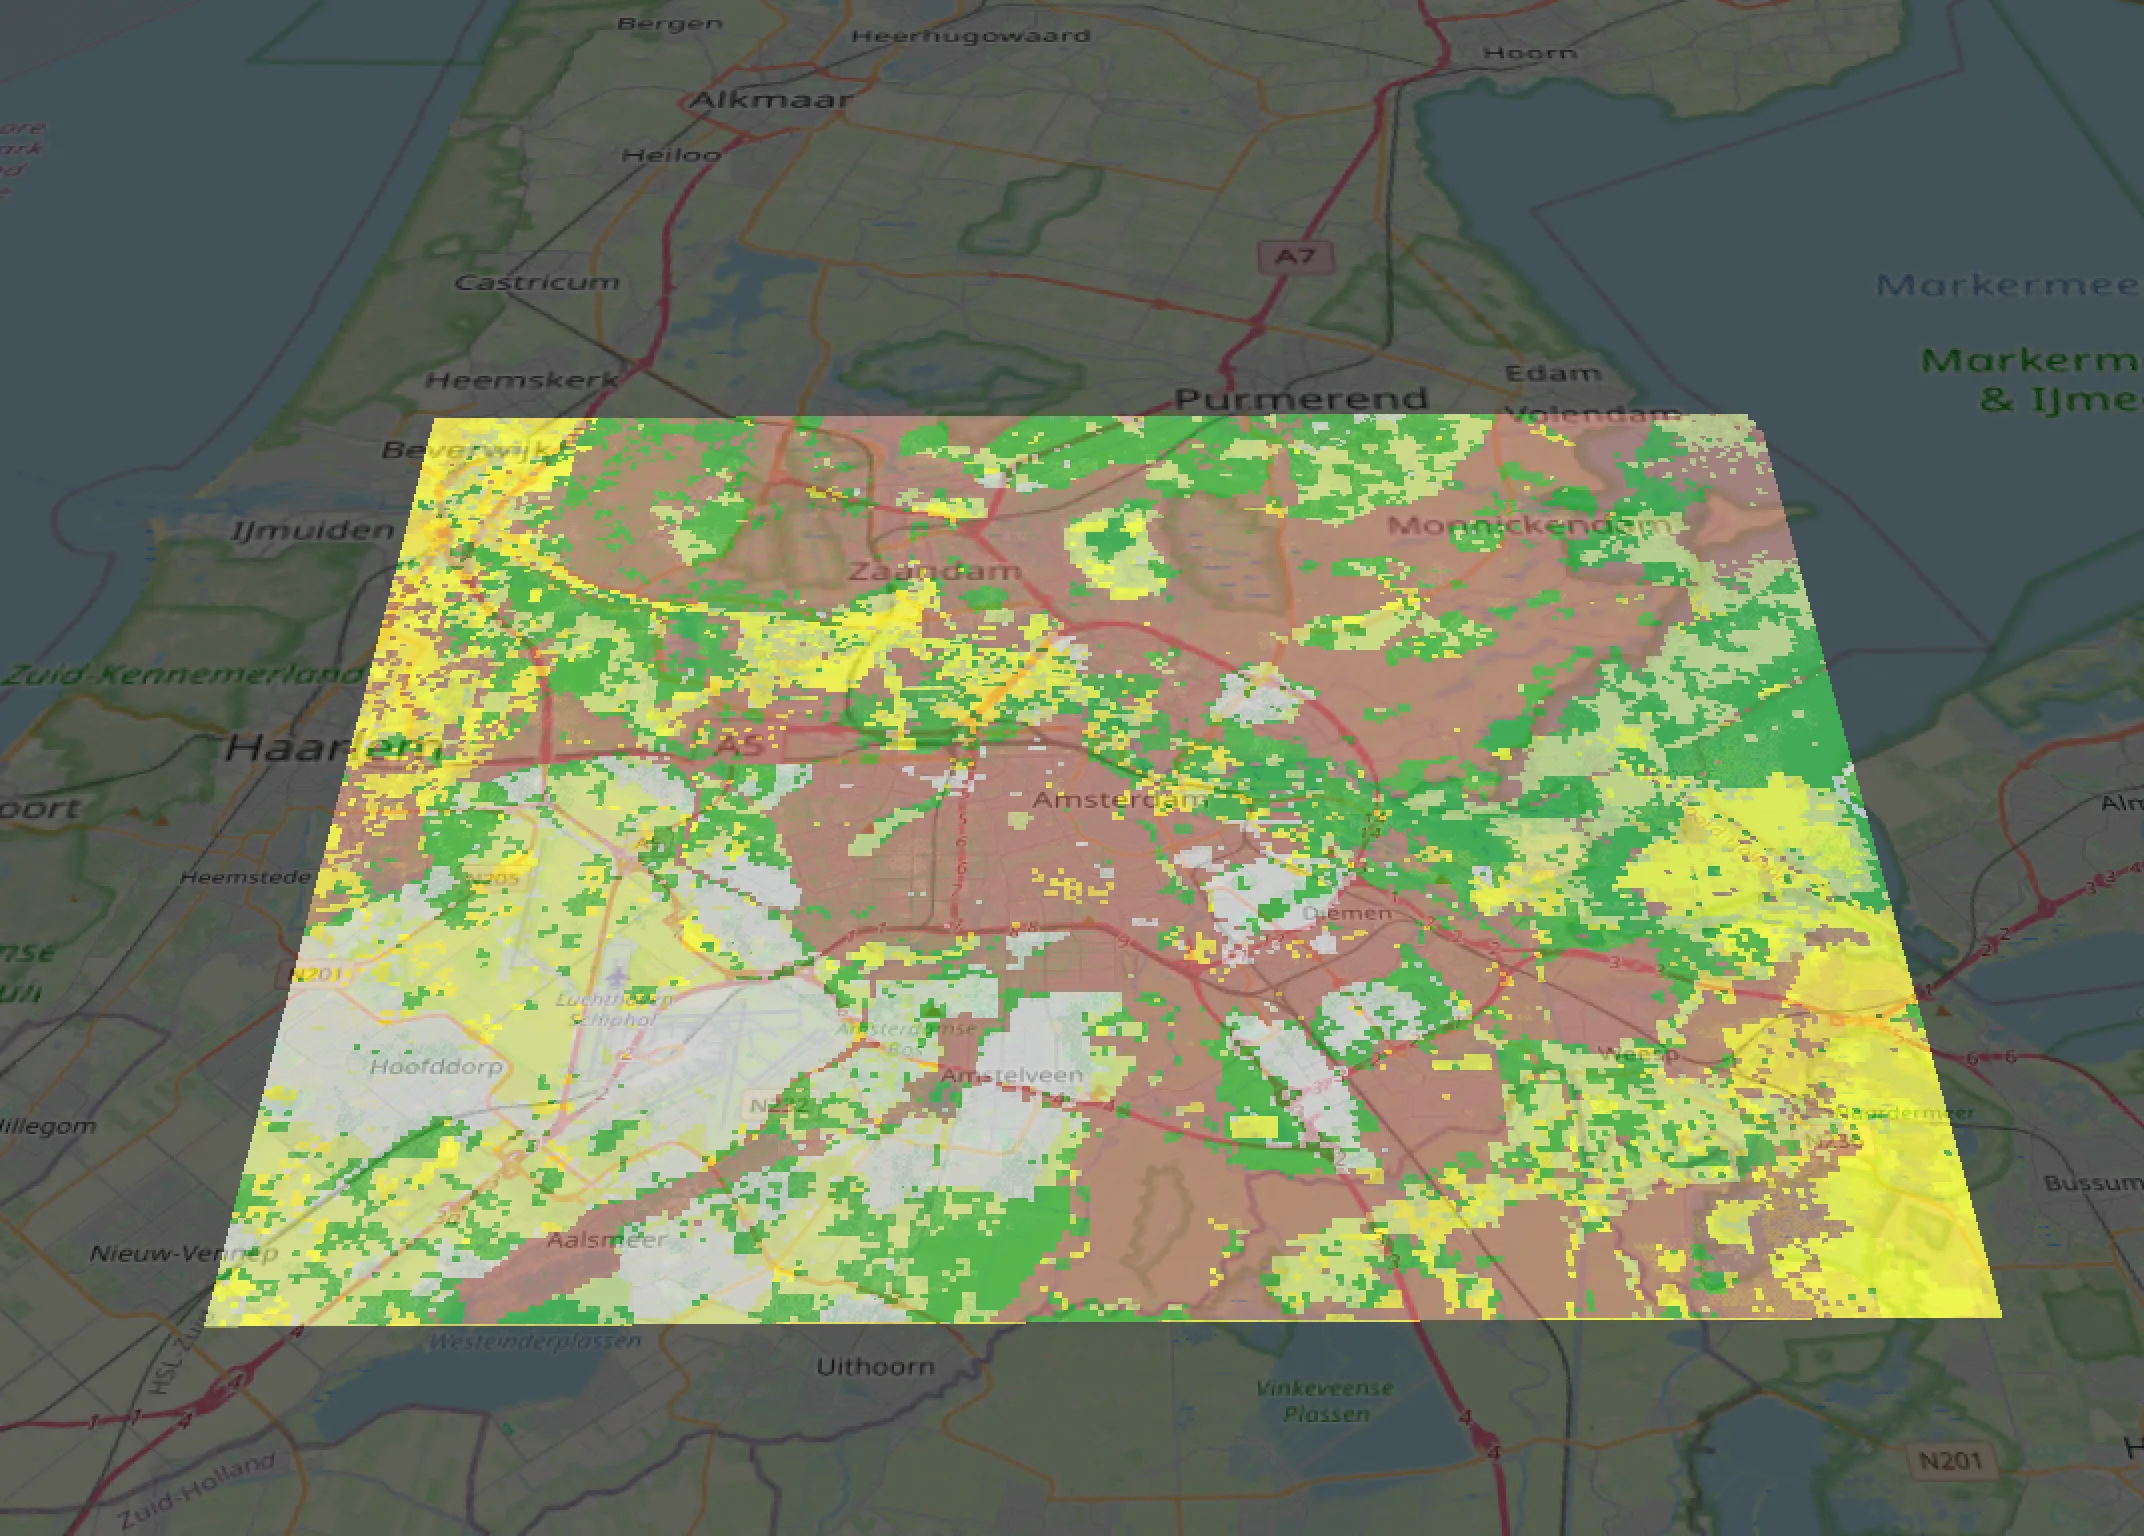
GeoTOP Voxels - CesiumJS
The Dutch GeoTOP shallow subsurface model visualized in 3D for the first time in a browser. Explore 100×100×0.5 meter voxels containing lithoclass information across Amsterdam, Delft, and Utrecht using CesiumJS with the 3D Tiles Voxel extension.More about our voxel work →
Explore demo→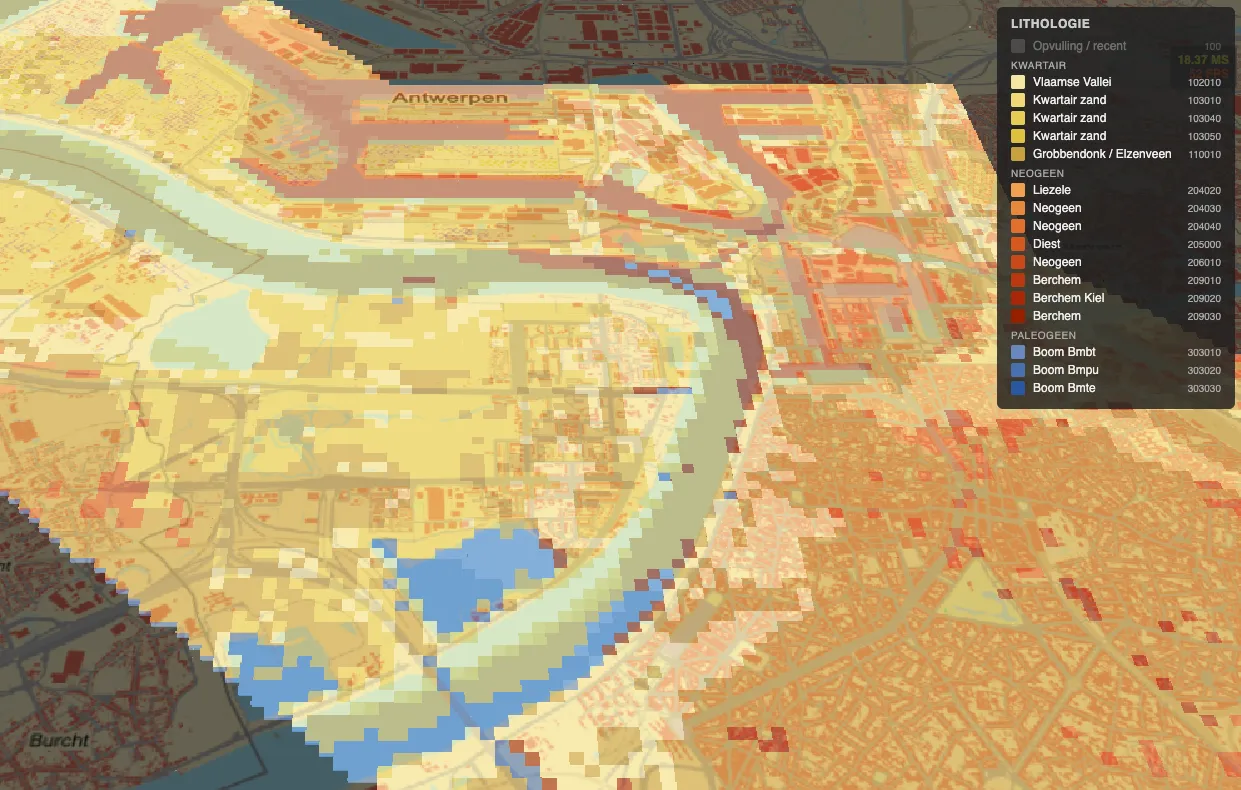
Antwerp Geological Model - CesiumJS
The Flemish DOV shallow subsurface model of the Antwerp urban region and harbor visualized as 3D Tiles Voxels in CesiumJS. Explore 25×25×0.5 metre voxels — over 21 million in total — containing proportional lithological composition (peat, clay, silt, sand, gravel) from ground level to 50 metres depth.
Explore demo→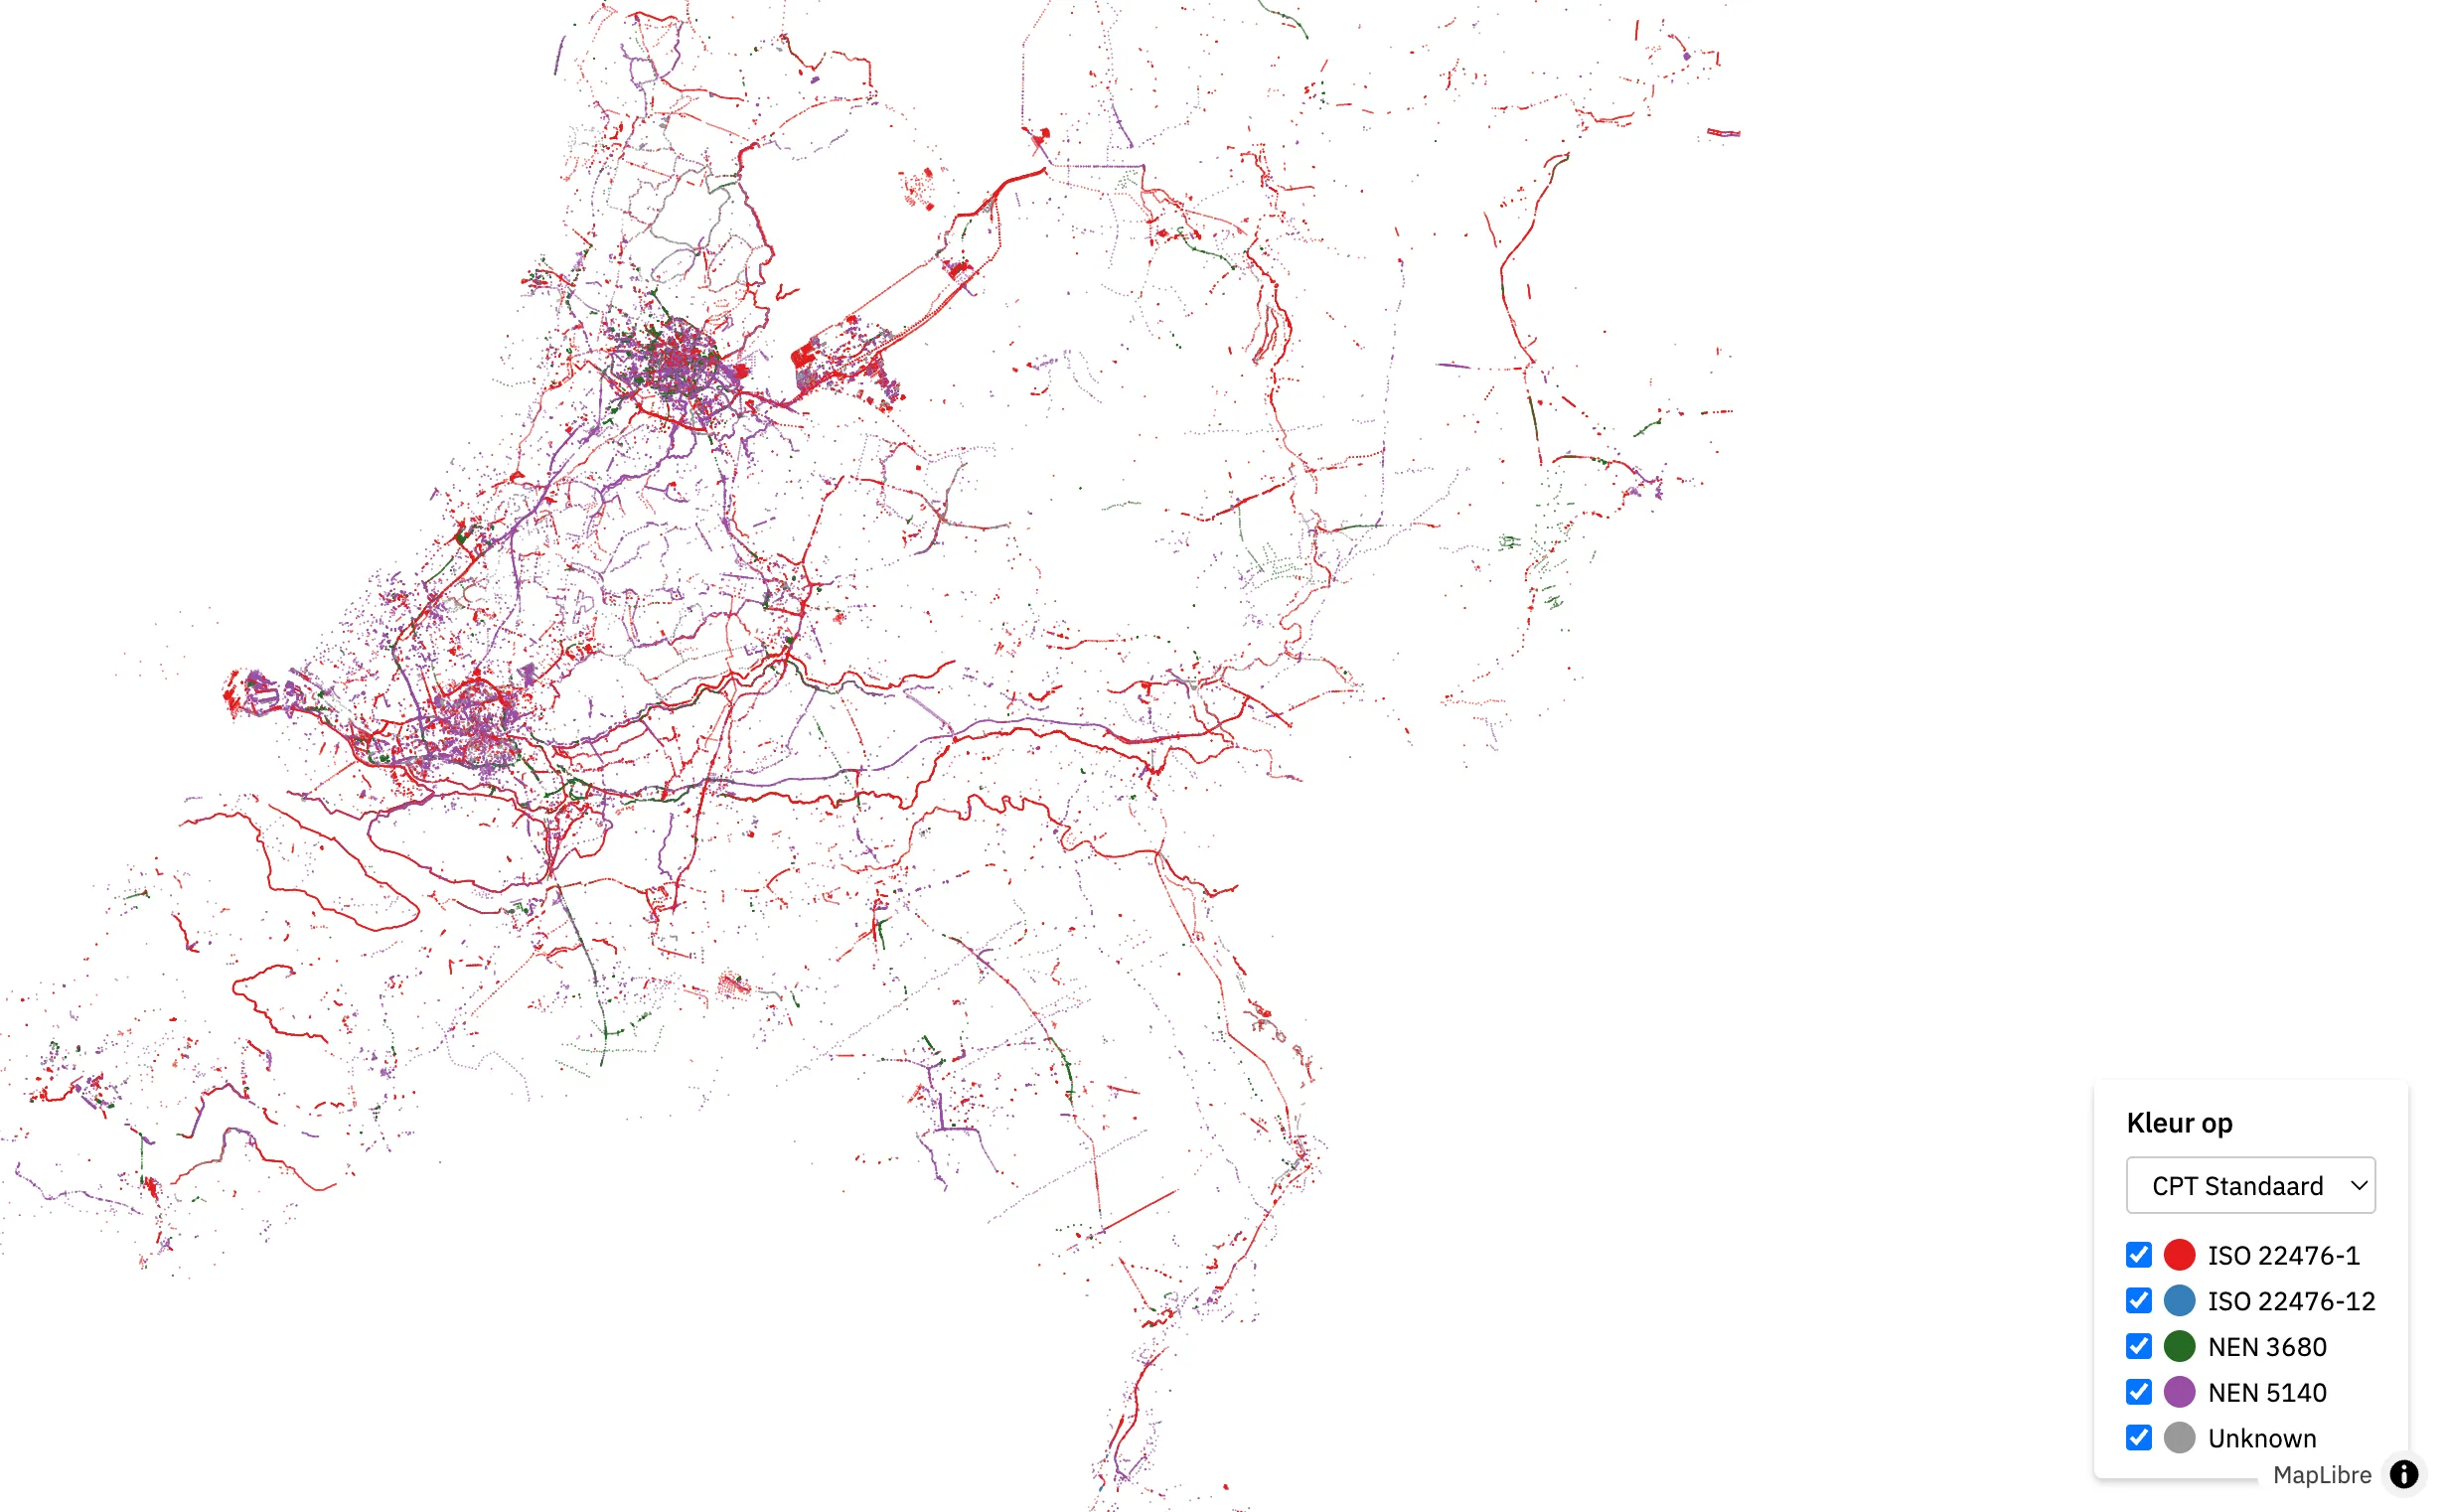
Dutch BRO CPTs - MapLibre GL & PMTiles
All 237,297 Cone Penetration Tests from the Dutch subsurface registry rendered instantly in your browser using MapLibre-gl. Zoom, filter, and remap colors without any lag. No tile server required, just one 35 MB PMTiles file served as a static asset.
Explore demo→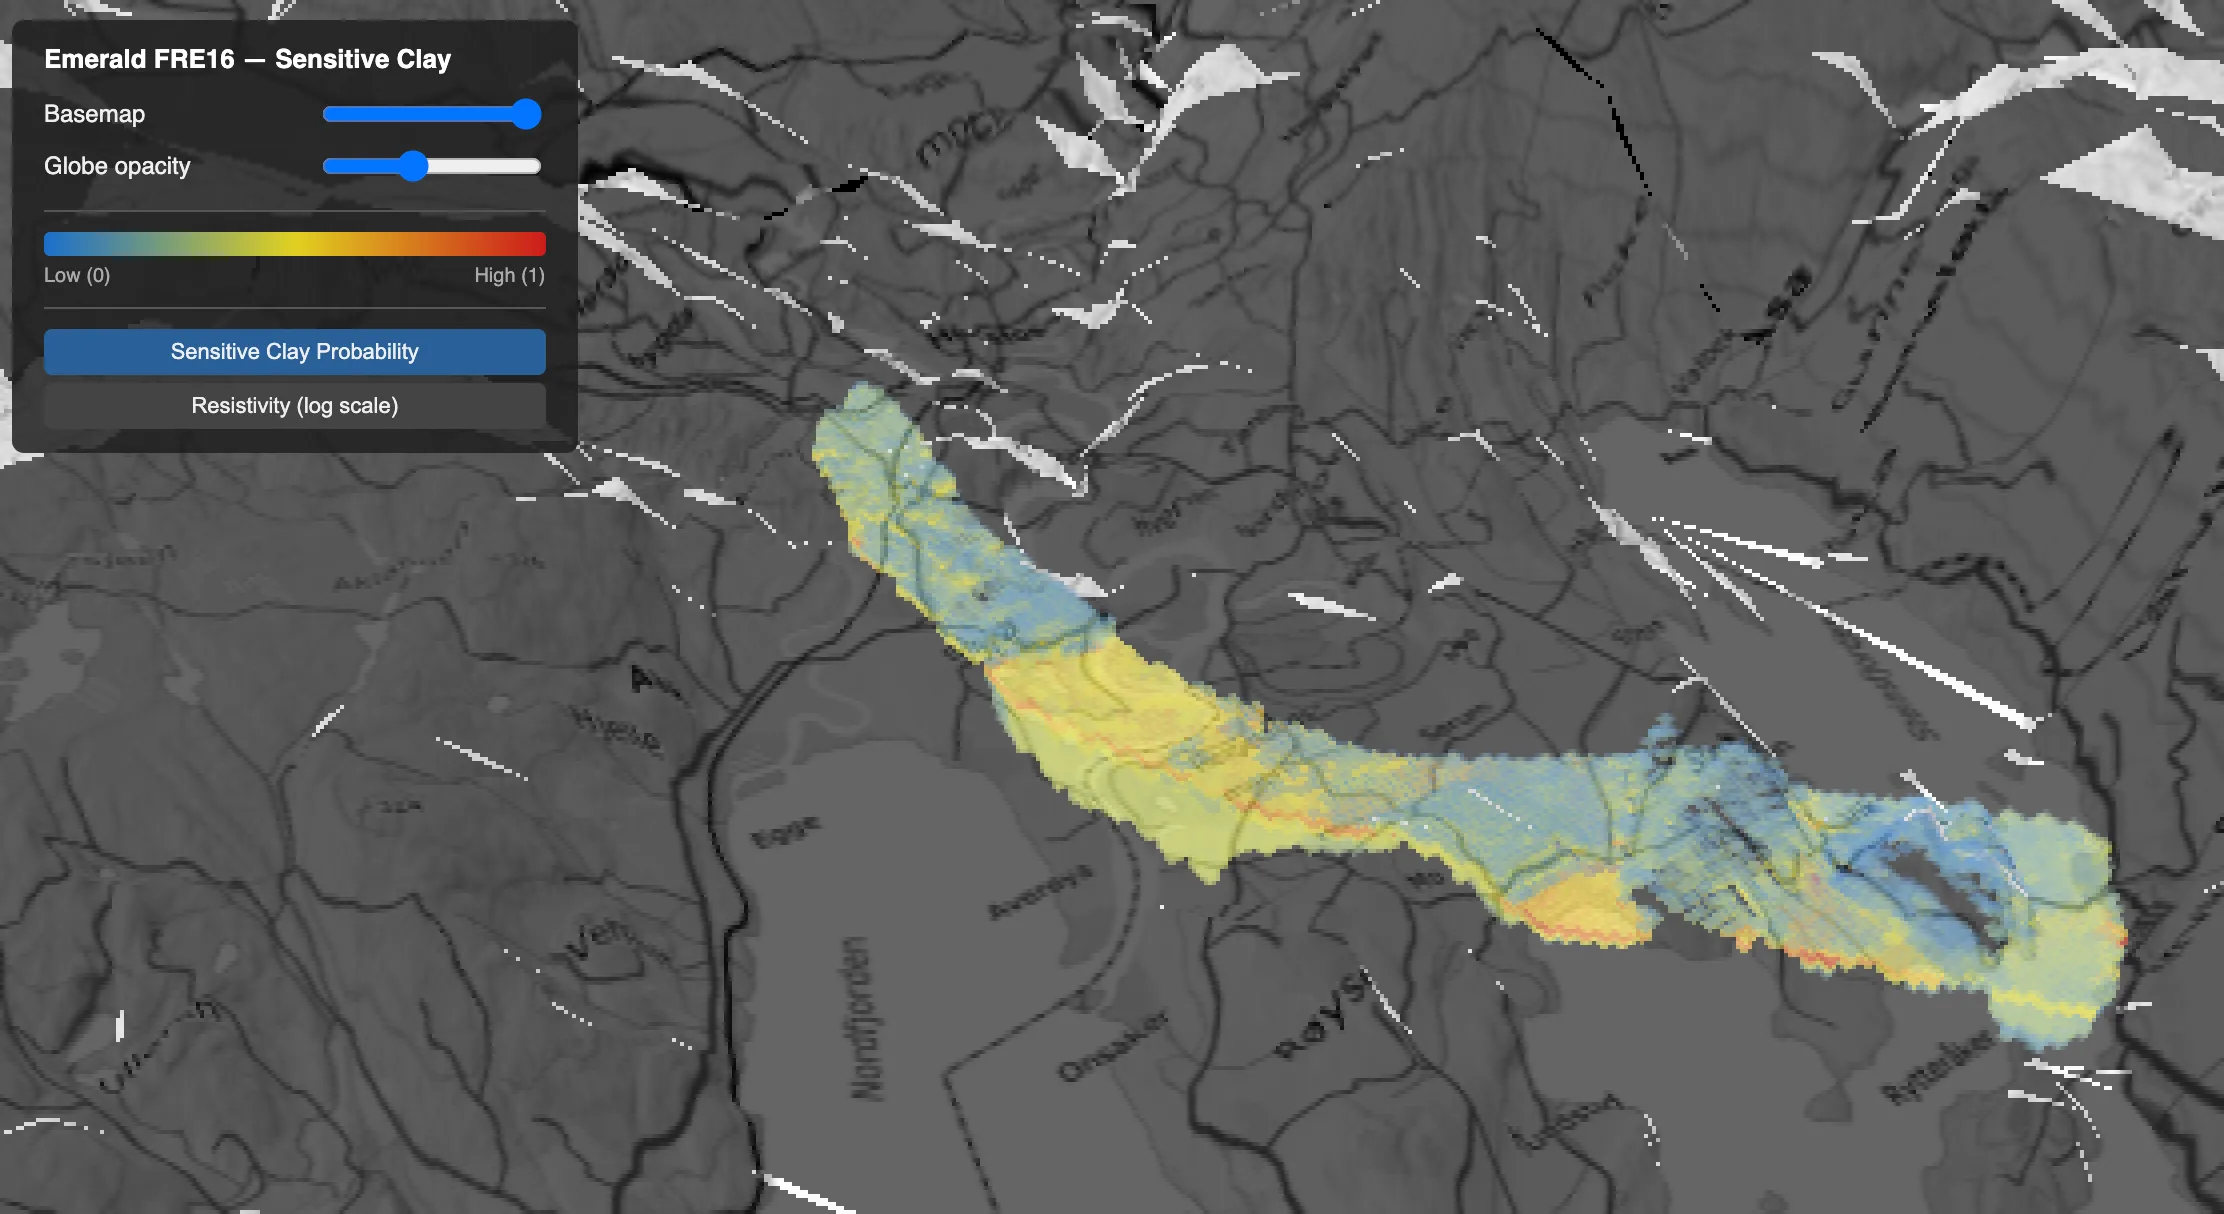
Emerald FRE16, Norway - CesiumJS
Sensitive clay probability and resistivity along a survey line in Norway, visualized as a 3D overlay on terrain in CesiumJS. Toggle between sensitive clay probability and log-scale resistivity. Data courtesy of Emerald Geomodelling.
Explore demo→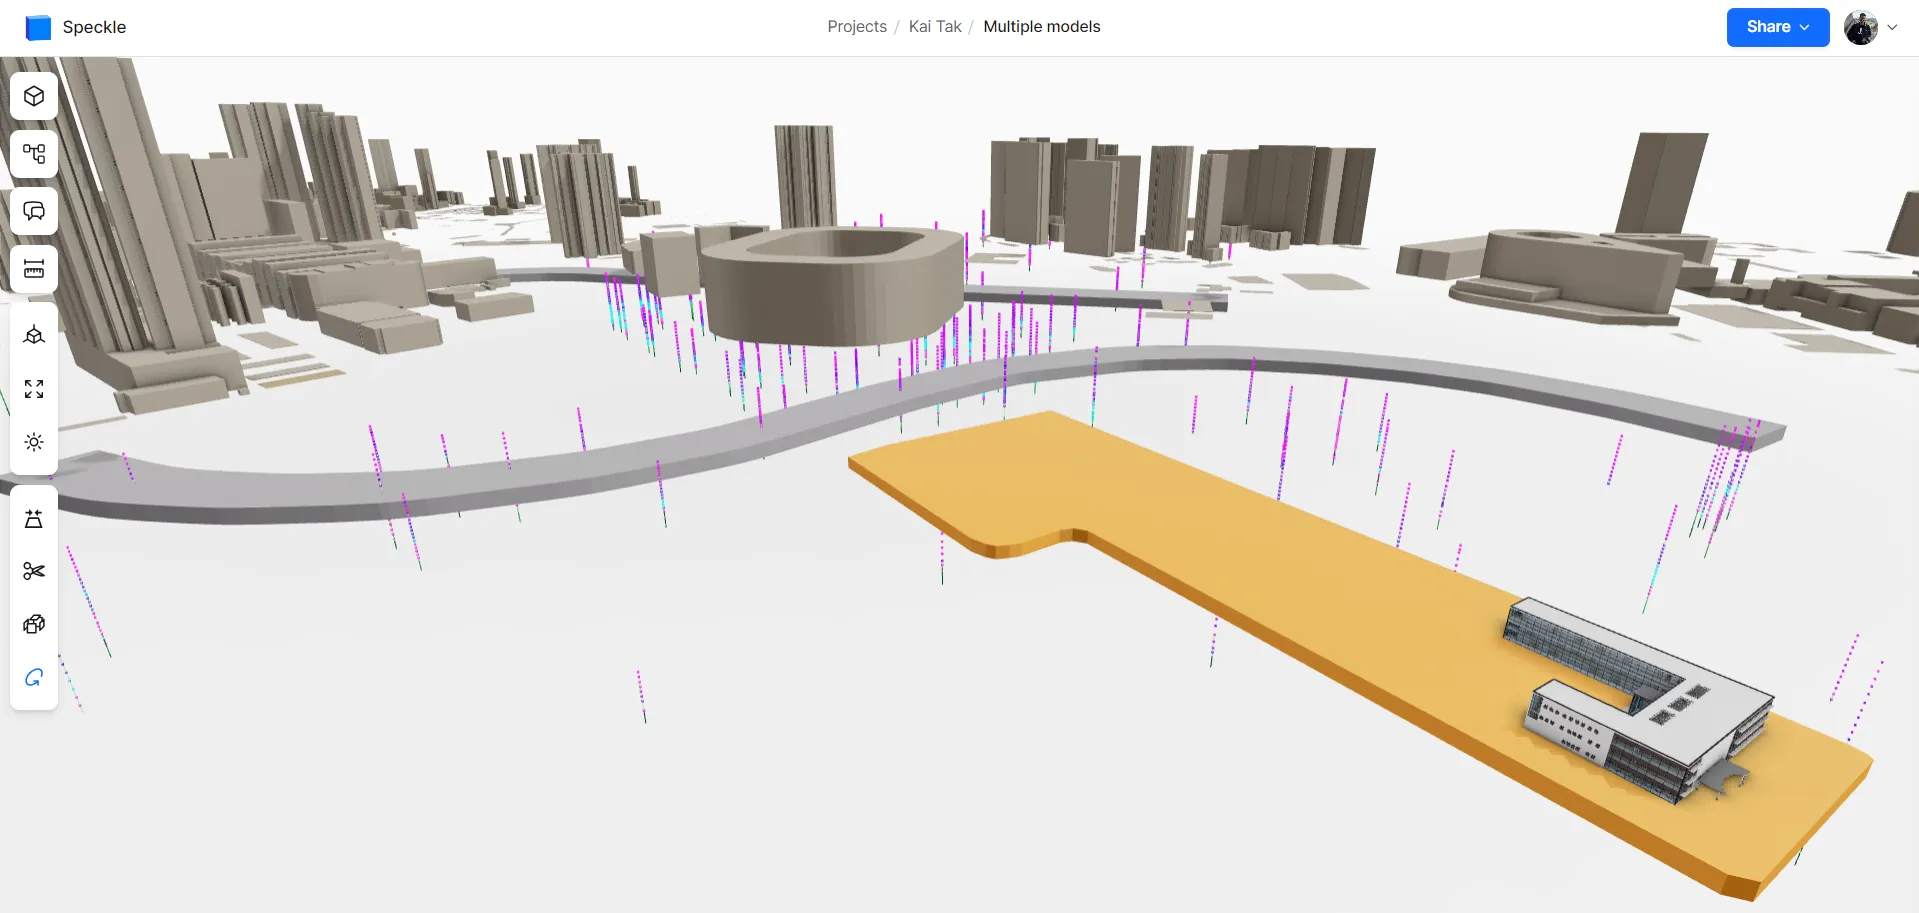
Kai Tak - Speckle
Building models from Revit and Civil3D combined with geotechnical data. View subsurface conditions alongside structural designs in Speckle.
Open in Speckle→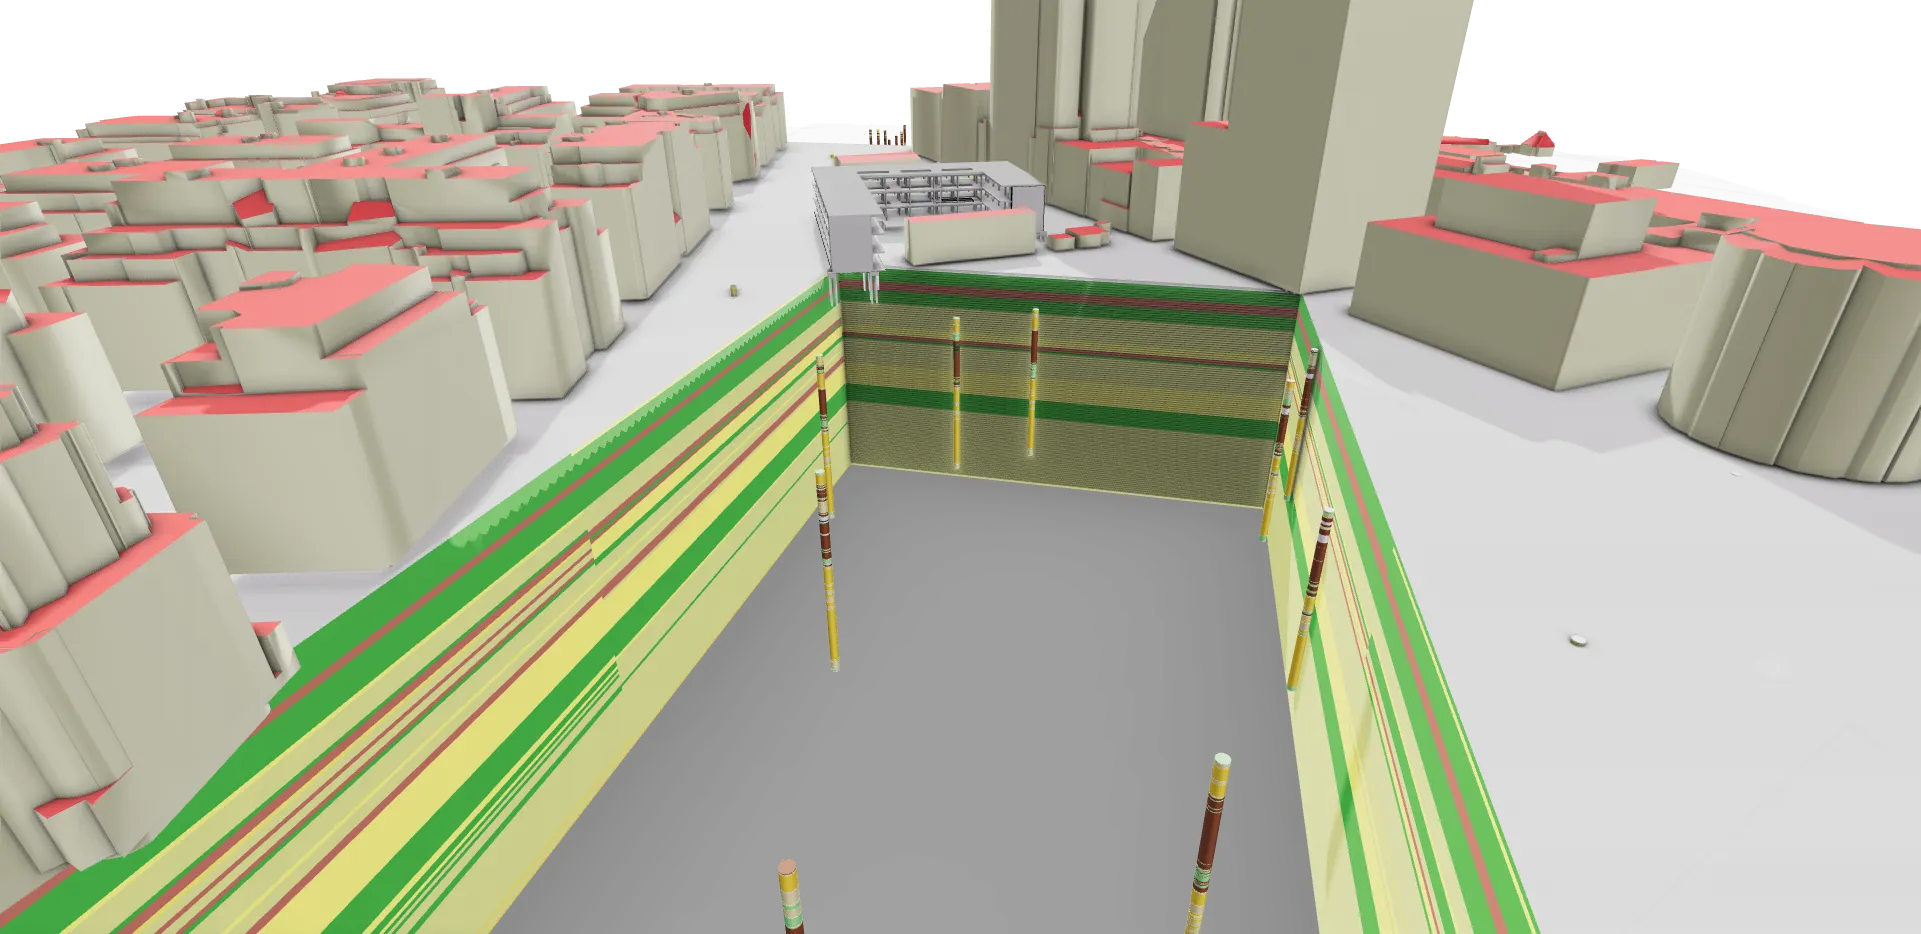
Amsterdam Noord - Speckle
Subsurface data from Amsterdam Noord visualized in Speckle for multi-disciplinary collaboration and BIM integration.
Open in Speckle→
Weka Hills - Speckle
Geological data visualization in Speckle showing subsurface conditions for infrastructure planning and design coordination.
Open in Speckle→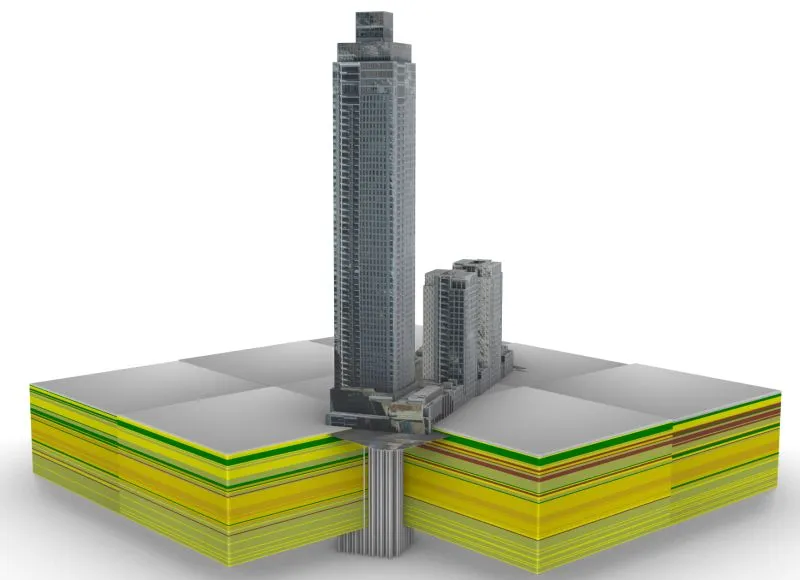
Rotterdam Buildings & GeoTOP - Speckle
Prominent Rotterdam buildings (Zalmhaven, Maastoren, and Blaak/Markthal) shown in Speckle together with their foundations and the GeoTOP voxel model. GeoTOP represents the first 50 metres of the Dutch subsurface as 100×100×0.5 m voxels containing lithoclass and lithology information.
No demos match these filters yet.
Looking for something specific? Schedule a Discovery Call or email us.
Want to see your ground investigation data visualized?
We build custom visualizations and web applications for subsurface data.